

The AI stock market bubble question has become harder to dismiss. Yet a market rout cannot tell us when a bubble will finish deflating, or whether every AI business deserves the same verdict. The useful question is whether earnings and cash generation can justify the expectations in share prices.
Market analysis, researched 10 November 2026, before the U.S. trading session. Market context runs through the 9 November close. Company figures below cover different reporting periods and are in U.S. dollars. This is desk research and editorial analysis, not a forecast or a recommendation to buy or sell securities.
Wall Street has seen both a sell-off and a rebound
On 5 November, the S&P 500 fell 4.4% and the Nasdaq Composite lost 5.5%. AP’s report documents that session.
On 9 November, the S&P 500 gained 2.3% and the Nasdaq Composite rose 2.7%, according to AP’s closing roundup.
Those are separate daily changes, not cumulative returns. A sharp recovery does not erase the earlier loss or establish that the selling is over.
Tech-Play’s report on the 29–30 October AI-stock decline explains the earlier earnings reaction. November raises a broader question: how much disappointment can the investment cycle absorb?
There are several moving parts. Schwab’s 9 November market update, published at 9:22 a.m. Eastern Time, described pressure on technology shares, changing interest-rate expectations and an early rebound helped by falling oil prices. It was an opening report, not that day’s closing result. A stock move cannot reliably be attributed to AI sentiment alone.
Follow the stocks with TradingView
The Stocks tab below contains Apple (AAPL), Adobe (ADBE), Nvidia (NVDA) and Tesla (TSLA). AI infrastructure adds Microsoft (MSFT), Alphabet (GOOGL), Amazon (AMZN) and Meta (META). The other tabs provide index proxies and cryptocurrencies for broader market context.
This embedded TradingView Market Overview updates when you view it. Its values can be newer than this article. Check each instrument’s currency, market status and data timestamp. TradingView’s data documentation explains exchange delays and availability limits. Quotes are for context, not trade execution.
The Indices tab uses FOREXCOM feeds, including SPXUSD and NSXUSD. These are provider instruments referencing markets, not the official closing series used in the reporting above. In particular, the Nasdaq-100 exposure represented by NSXUSD differs from the Nasdaq Composite. Crypto is a separate asset class; its movements do not measure AI business performance.
Use the tabs to compare direction and timing, then investigate the business behind a move. This small watchlist is an editorial selection, not a representative AI index or a ranking of investments.
Real revenue does not settle the AI bubble debate
An investment bubble can develop around useful technology. The technology can succeed while some shareholders lose money, because the price they paid assumed even greater success.
Microsoft’s results released on 28 October illustrate why the debate cannot be reduced to “AI has no customers.” For the quarter ended 30 September 2026, Microsoft reported $92.3 billion in revenue, up 19% year over year, and $45.9 billion in operating income, up 21%. Azure revenue grew 48%. These are company and business measures, not a separately reported total of AI revenue.
Nvidia’s 26 August earnings-call transcript reported $96 billion in revenue for its fiscal second quarter of 2027, more than double the year-earlier amount. That is an earlier period than Microsoft’s September quarter; fiscal-year labels are not calendar dates. It also measures supplier sales, not the eventual investment return earned by customers buying the equipment.
The interpretation is the difficult part. A chip sale can be profitable for its supplier before the buyer has established a sustainable business using that chip. Counting the same spending as evidence of success at every stage would overstate what has been proven.
AI spending is turning the spotlight toward cash flow
Alphabet’s 28 October earnings call provides a concrete example. Management reported negative free cash flow of $9.1 billion for the third quarter, while trailing 12-month free cash flow remained positive at $19.7 billion. It retained 2026 capital-expenditure guidance of $195 billion to $205 billion and said spending would increase significantly in 2027. The latter is management’s outlook, not an achieved result.
Management attributed the quarterly cash pressure to capital investment, with inventory for TPU system sales and payment of a European Commission fine also affecting the figure. Describing the entire shortfall as an AI operating loss would be inaccurate.
Capital expenditure buys assets such as servers and data centers. The cash goes out when payment is made, while depreciation spreads an asset’s cost through later income statements. That timing helps explain how a company can report operating profit while free cash flow deteriorates.
For readers assessing the investment cycle, three questions are more useful than a single spending headline:
- What is earning money now? Separate recognized revenue from reservations, announced partnerships and contractual backlog.
- What must still be paid for? Read capital-spending guidance alongside leases, purchase commitments and financing needs. Check definitions before adding figures together.
- What return will the investment produce? Look for evidence that customers keep paying enough to cover the infrastructure, power and other operating costs.
A negative quarter does not establish insolvency. Equally, a large revenue backlog does not put all of that cash in the bank today. The timing and terms matter.
A stock can fall even when earnings grow
Consider a fictional company earning $5 per share. At a price-to-earnings ratio of 40, its share price would be $200. If earnings rise to $6 but investors become willing to pay only 25 times earnings, the price becomes $150.
Earnings increased 20%; the share price fell 25%. This is a worked example, not a valuation of Nvidia or any other company, and the dollar amounts are hypothetical.
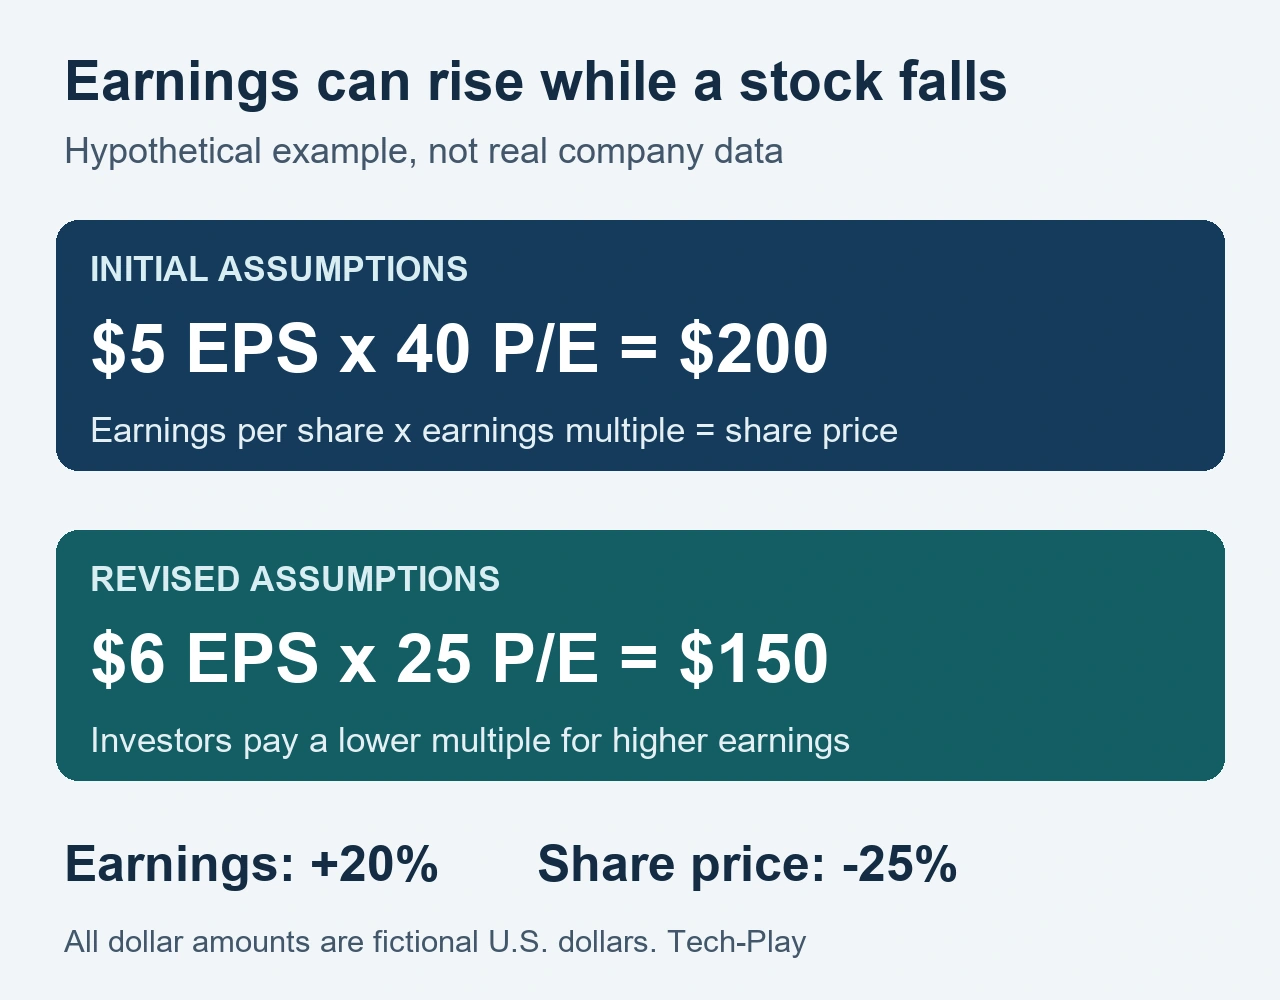
The example exposes the weakness in both easy arguments. “AI demand is growing” does not prove a stock is attractive at its current price. “The stock fell” does not prove its products have stopped being useful. A lower earnings multiple can reflect reduced growth expectations, higher perceived risk or a higher return available elsewhere.
For a loss-making company, a conventional positive P/E ratio may not be meaningful. Its financing runway and the assumptions required to reach positive cash generation deserve closer attention.
Which evidence would strengthen the bubble-bursting case?
Our assessment is that a sustained breakdown would become more convincing if deterioration appeared across demand, funding and returns together. These are scenarios to investigate, not claims that every condition has occurred:
- Demand disappoints: customers reduce purchases, cancel capacity or renew contracts on substantially weaker terms.
- Funding tightens: infrastructure builders struggle to refinance obligations or need more expensive capital to keep expanding.
- Returns weaken: spending keeps rising without a credible improvement in the cash earned from the installed capacity.
- Pressure spreads: weakness reaches several business models and more of the market, rather than remaining concentrated in a few names.
The alternative case also needs evidence. Continued customer growth, improving cash generation and manageable investment commitments would support the argument that expectations are adjusting while the underlying business keeps developing. A few green trading sessions would provide much less information.
Treat company explanations as claims to evaluate. For example, management may describe low cash flow as a temporary consequence of building capacity. Later results should show whether that capacity earns the expected return.
A five-question check before reacting to the next headline
Copy this checklist when an AI-stock story reaches your feed:
- What moved, over which dates? Distinguish one company’s shares, the Nasdaq Composite, the Nasdaq-100 and the wider market. Compare the same type of return over the same window.
- What new fact arrived? Find the earnings release, filing or official announcement behind the headline. Separate results from estimates and rumors.
- Is the number revenue, profit, cash flow or a commitment? These answer different questions. Check the reporting period and currency too.
- What assumption changed? Ask whether investors revised expected earnings, the price they will pay for those earnings, or both.
- What would change your conclusion? Write down the next observable result that would strengthen or weaken it. Avoid explanations that can accommodate every possible outcome.
AI-generated summaries can mix reporting periods or turn management guidance into a fact. Tech-Play’s AI-answer verification checklist offers a source-checking process you can reuse for financial claims.
One scheduled checkpoint is Nvidia’s fiscal third-quarter earnings call on 17 November, announced for 2 p.m. Pacific Time, or 5 p.m. Eastern Time. It was still ahead at this article’s research cutoff; its results are not assumed here.
The evidence supports taking valuation and funding risk seriously. It does not supply a reliable crash date. Use the widget to see what prices are doing, then use the underlying reports to judge what those prices require businesses to deliver.